LoV – Log visualisation Datavisualisation Programme #1, 2015
Context
« Numerical simulation has been one of the pillars of the scientific process since the origins of computing. Many disciplines, whether in climatology, geology, molecular biology or astrophysics, rely on computer tools to model the phenomena under study. Industry has seized on this tool to replace costly experiments (crash tests, aerodynamic tests in wind tunnels, oil drilling, etc.) with equivalent simulations. All these numerical simulations use High Performance Computing (HPC) to reduce the duration of the simulation. Indeed, a simulation can require the equivalent of several months of calculation. Rather than carrying out all the calculations on one machine, the techniques used in HPC consist of dividing up the calculations in order to distribute them over several machines working in parallel. This means that the execution time of a simulation can be divided by 1000 if enough machines are used.
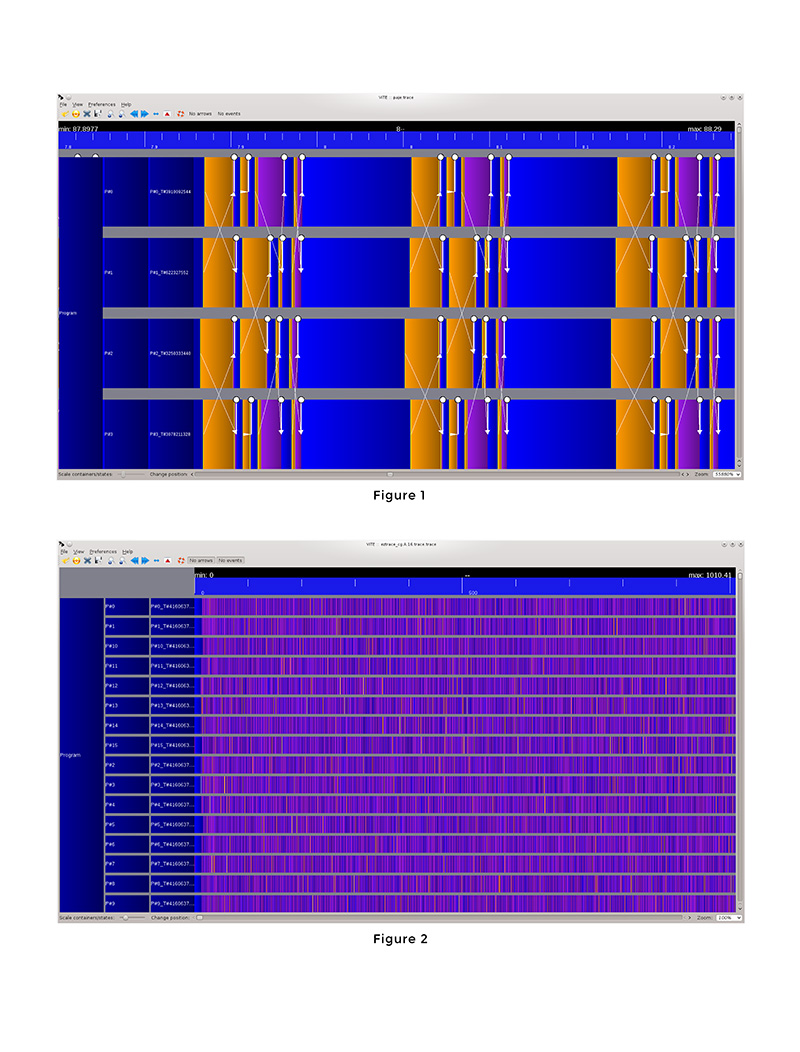
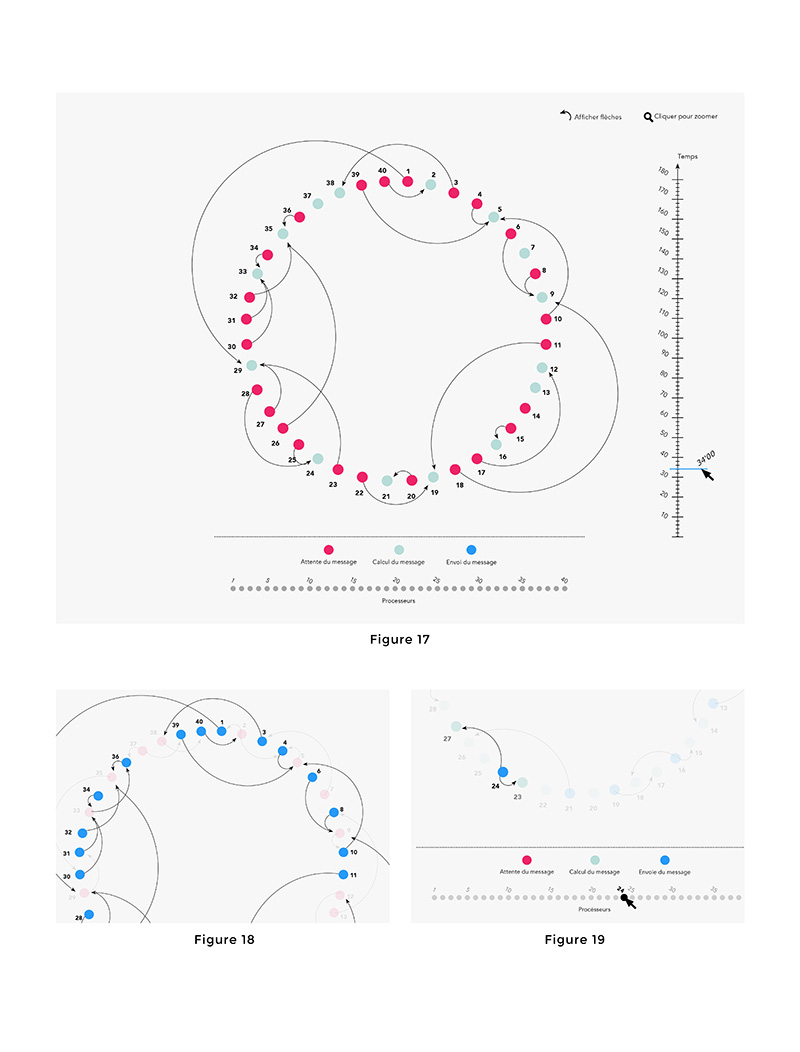
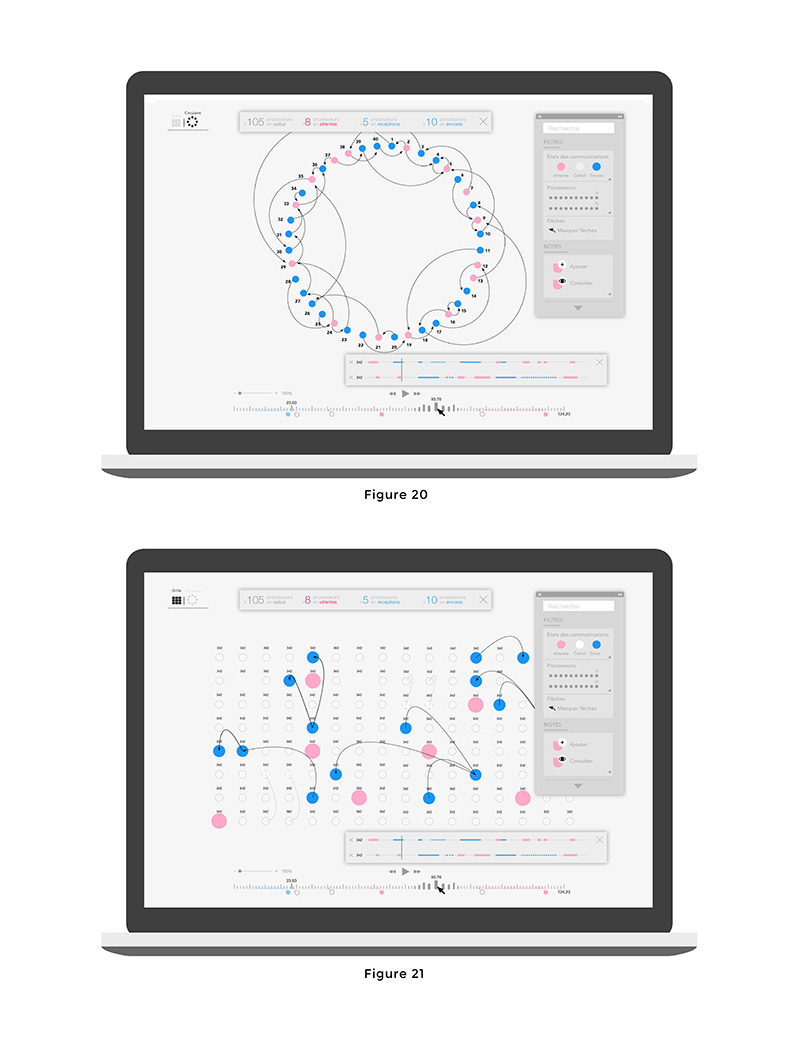
The development of parallel applications that make efficient use of a supercomputer is, however, a complicated task. For example, if the calculations are spread over 4 machines, the execution time is often not divided by 4. This is usually due to synchronisation phases between the machines: when a machine needs a result calculated by another machine, an exchange of messages via the network is necessary. It is therefore common for the application developer to have to analyse the execution of his program in order to find the origin of the performance problem. To do this, he can use tools such as EZTrace (Trahay, 2011). This type of tool makes it possible to run an application and capture important events (computation phases, network communications, etc.) in order to generate execution traces. These traces can then be visualised by the developer so that he can find the source of the performance problem […].
The goal of this project is to define a representation of execution traces so that the user is not overwhelmed with information and can identify the source of performance problems in a parallel application. »
– Extract from the article « exploration visuelle des traces de calcul haute performance», François Trahay, Eve-Lise Kern, Kévin Zanin, published in the book Datalogie, éd. Loco, 2016
Visualisation & Interface Design
Prototype
Capture vidéo commentée du prototype fonctionnel du logiciel, février 2016 :
Modifier vos réglages de cookies
Démarche de création
Communication de François Trahay, Eve-Lise Kern et Kevin Zanin au colloque Datalogie, octobre 2015 :
Modifier vos réglages de cookies
The LoV project continues in 2016 with a second iteration dedicated to the visualisation of recurrent patterns in computational traces.
A project of the Datavisualisation programme
Esad de Reims
Télécom SudParis / IMT, IP Paris
Graphic Designers
Eve-Lise Kern
Kevin Zanin
Engineers
Rindra Andriamanefo
Alexis Colin
François de Greef
Mathieu Henriette
Researcher
François Trahay, département d’informatique de Télécom SudParis
Organisation & supervision
Olaf Avenati - Esad de Reims
Michel Simatic - Télécom SudParis / IMT, IP Paris
