LoV.2 – Log visualisation Datavisualisation Programme #2, 2016
Following the first iteration of the programme, this second step of the work explores four visual hypotheses to represent the regular patterns found in François Trahay’s computational traces.
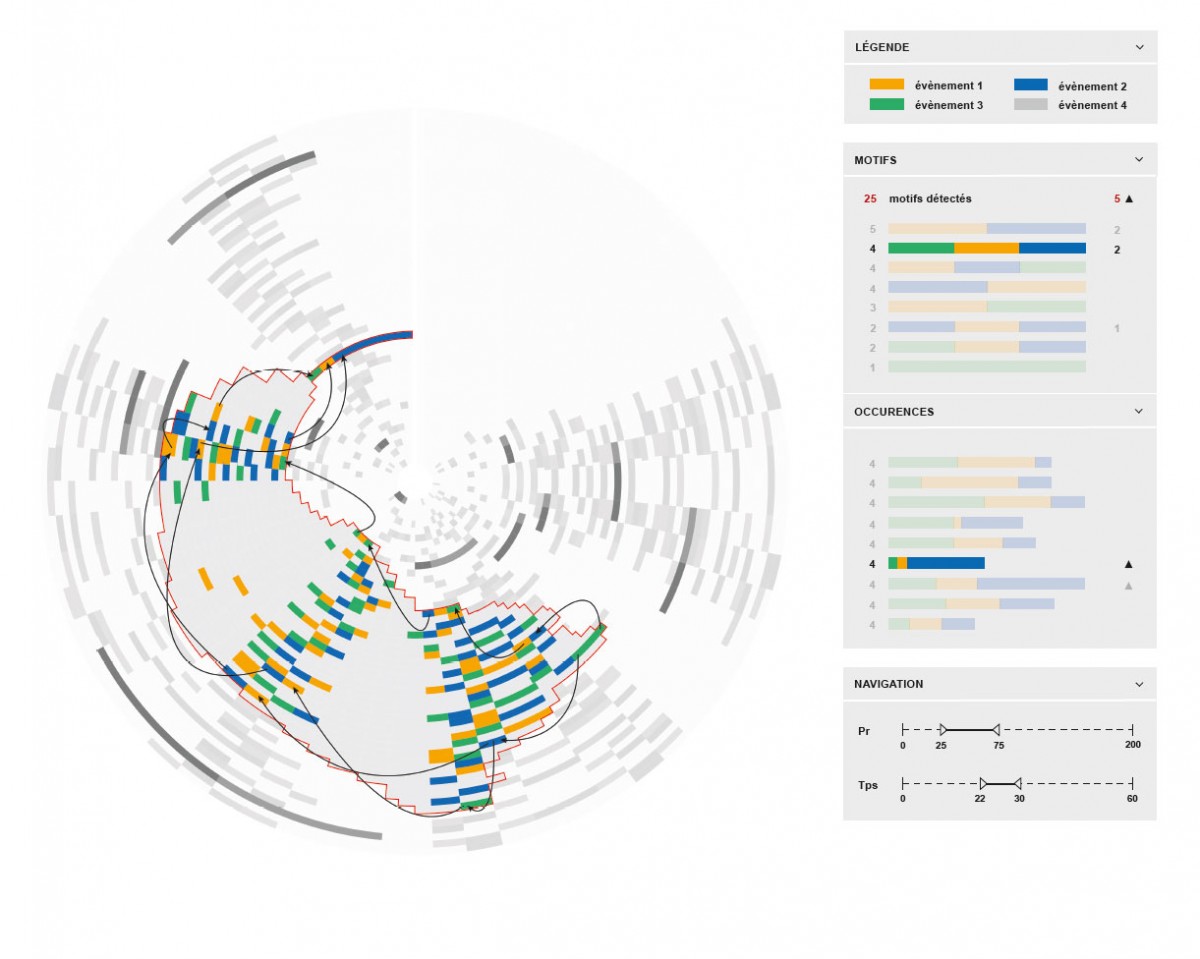
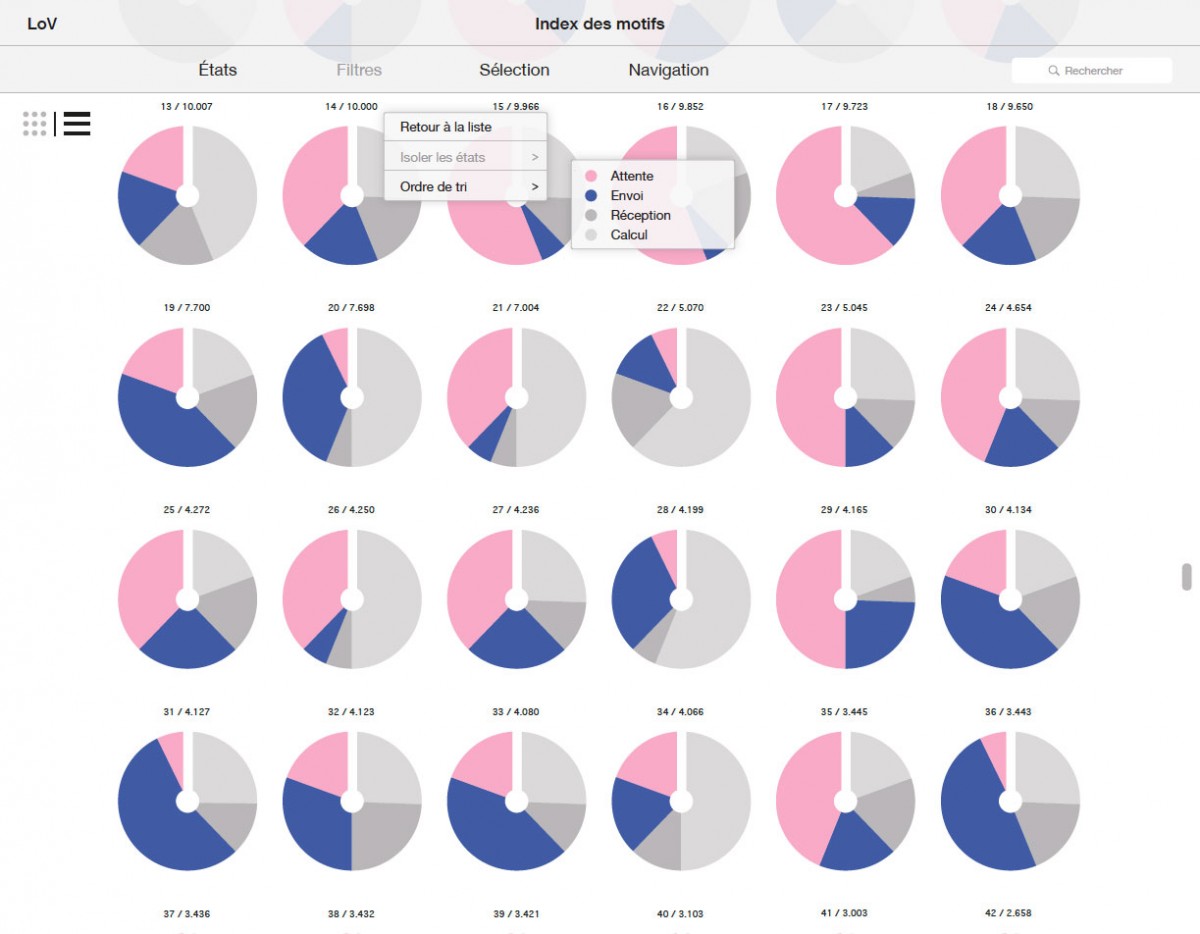
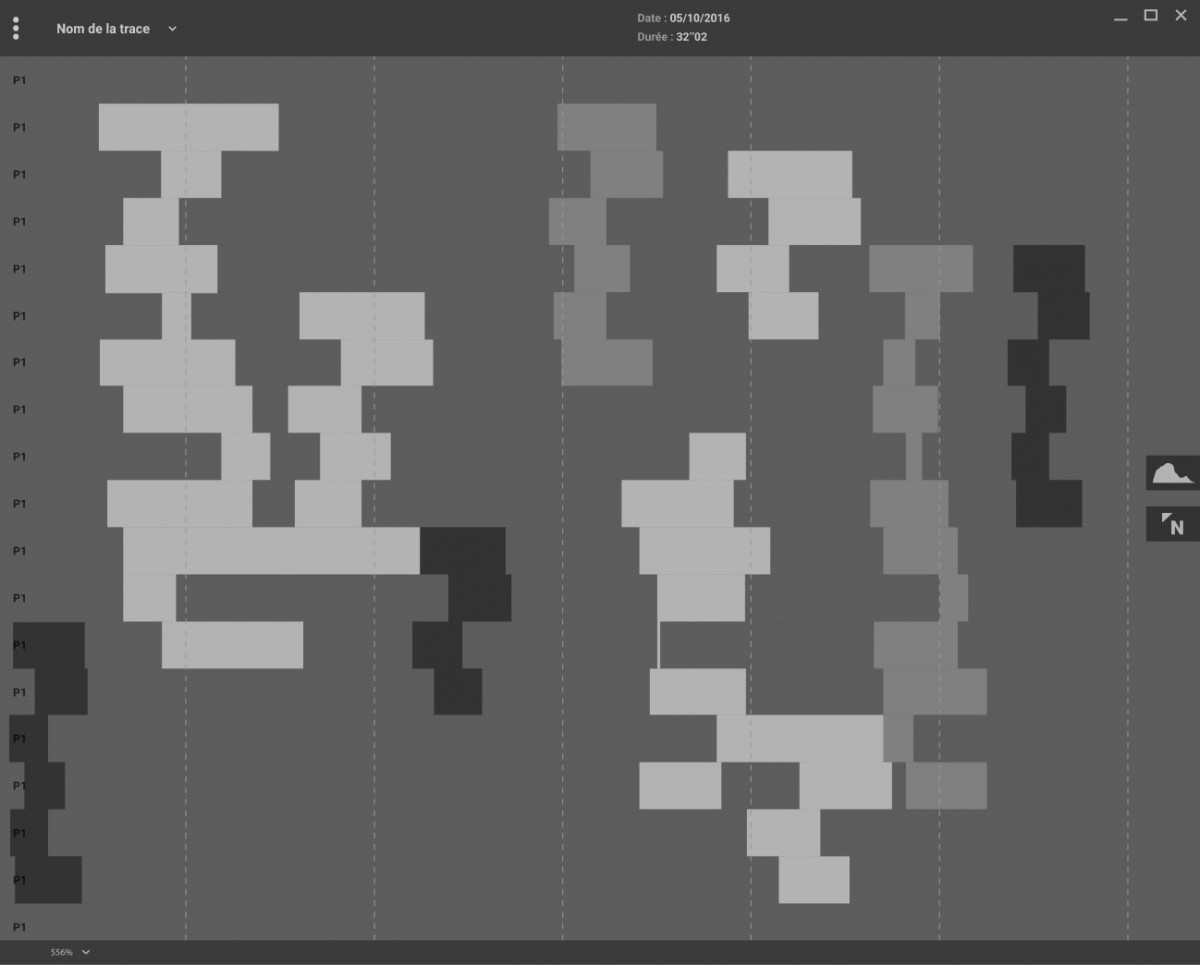
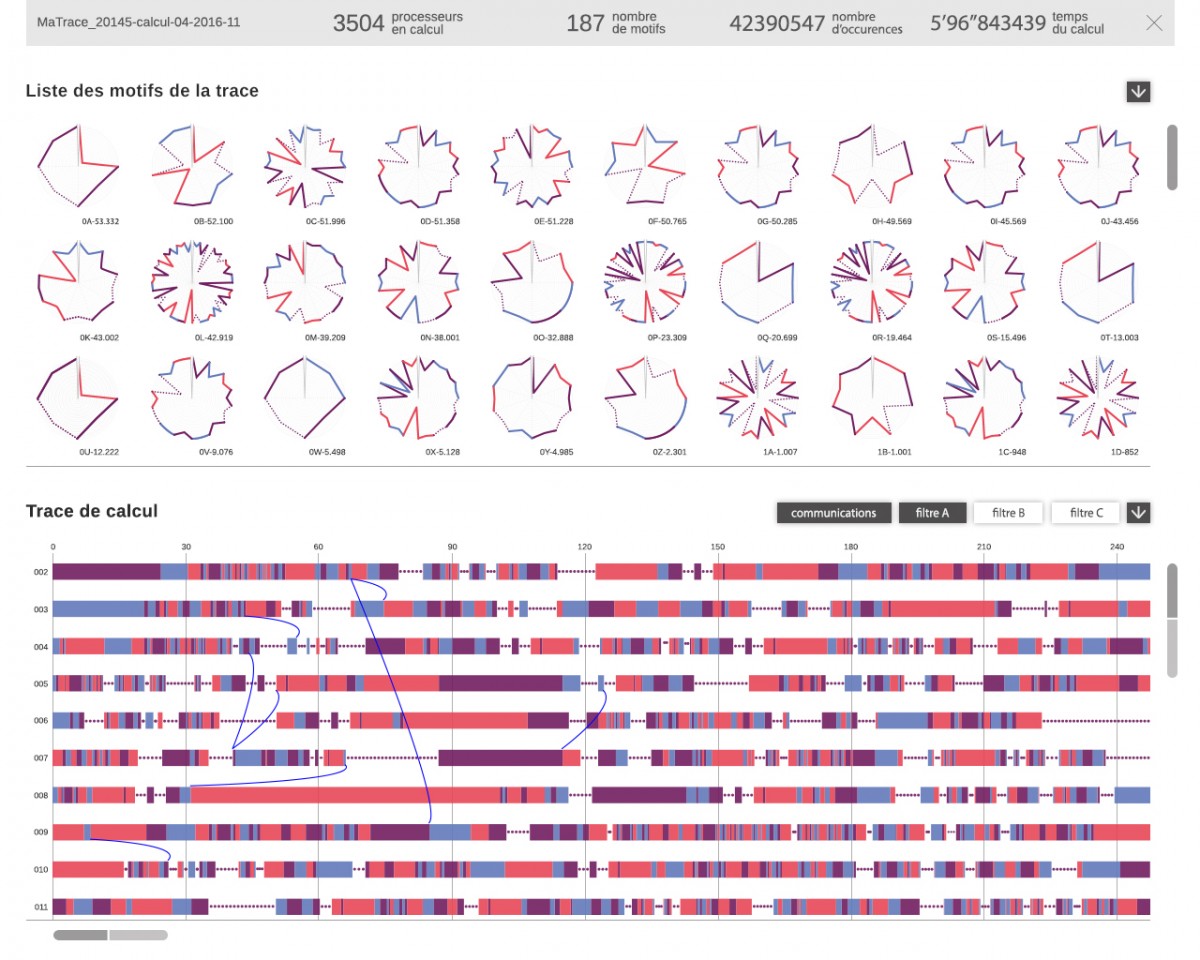
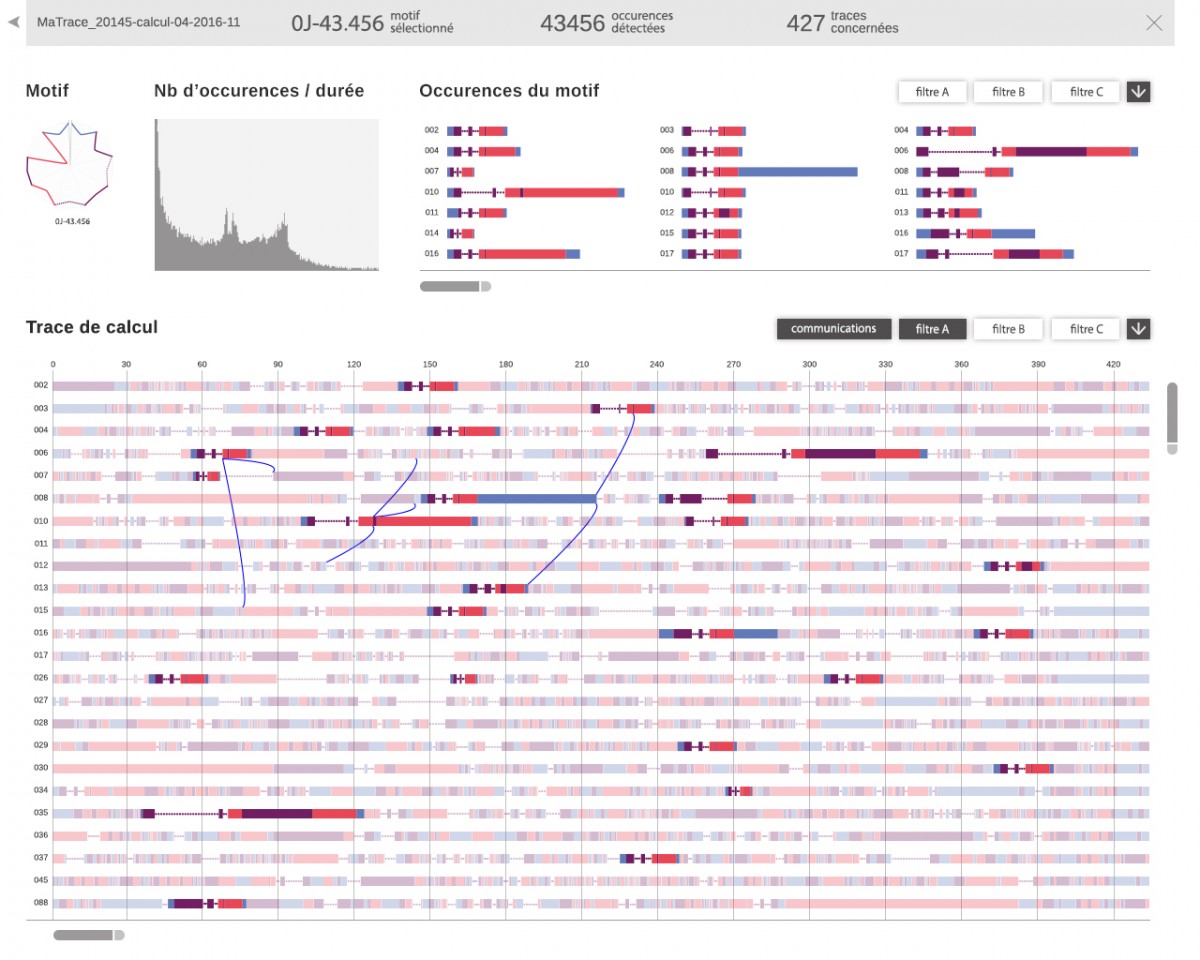
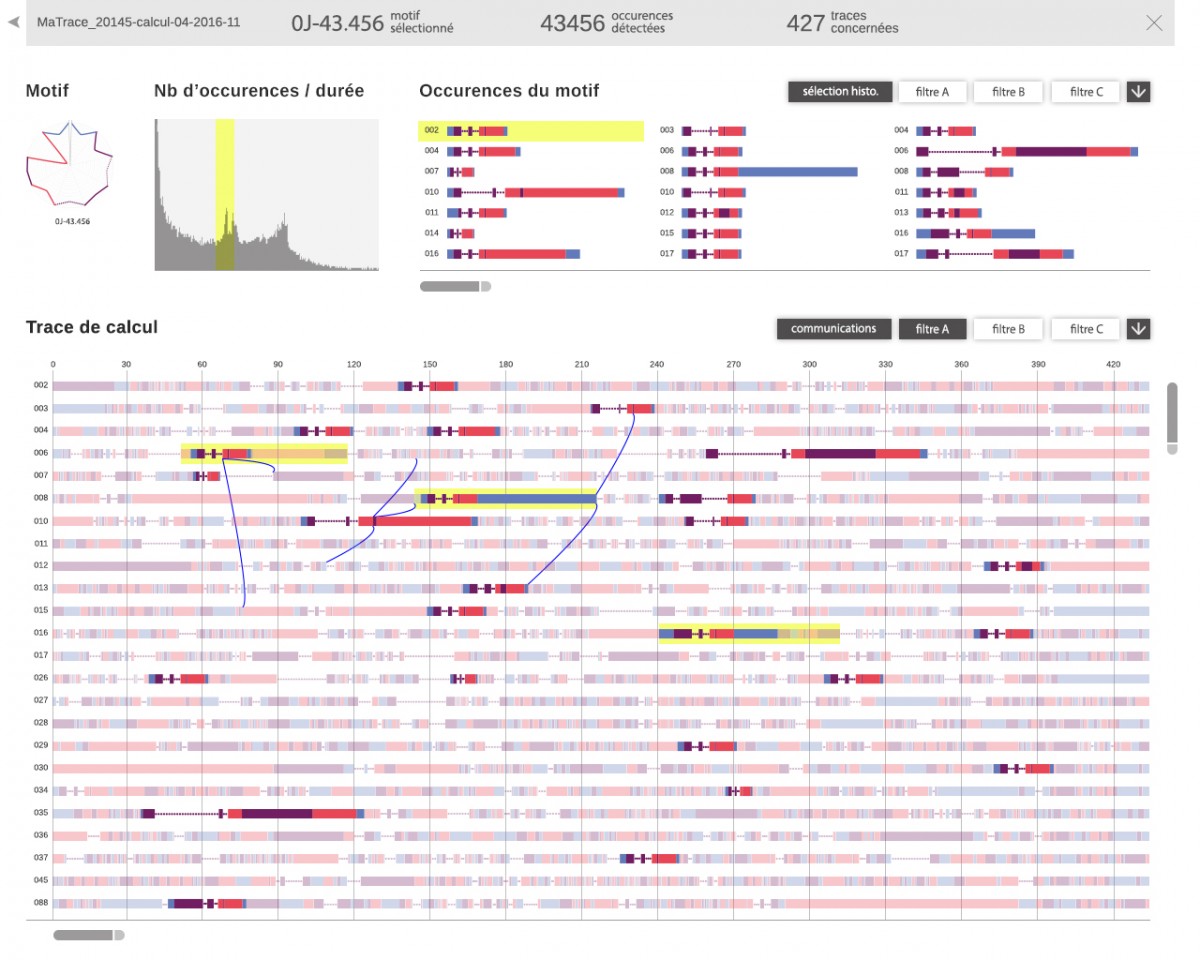
These patterns which are repeated in the trace are the signs of regularities in the course of the computation and are therefore interesting to identify and observe: if these patterns are optimizable, the general computation can then be clearly more efficient. These patterns have the particularity of having individual expressions that vary in duration and frequency. We can also find patterns inside other patterns.
Graphic research (extract)
Modifier vos réglages de cookies
Four graphic hypotheses
graphic hypothesis by Laura Ollivier - pdf
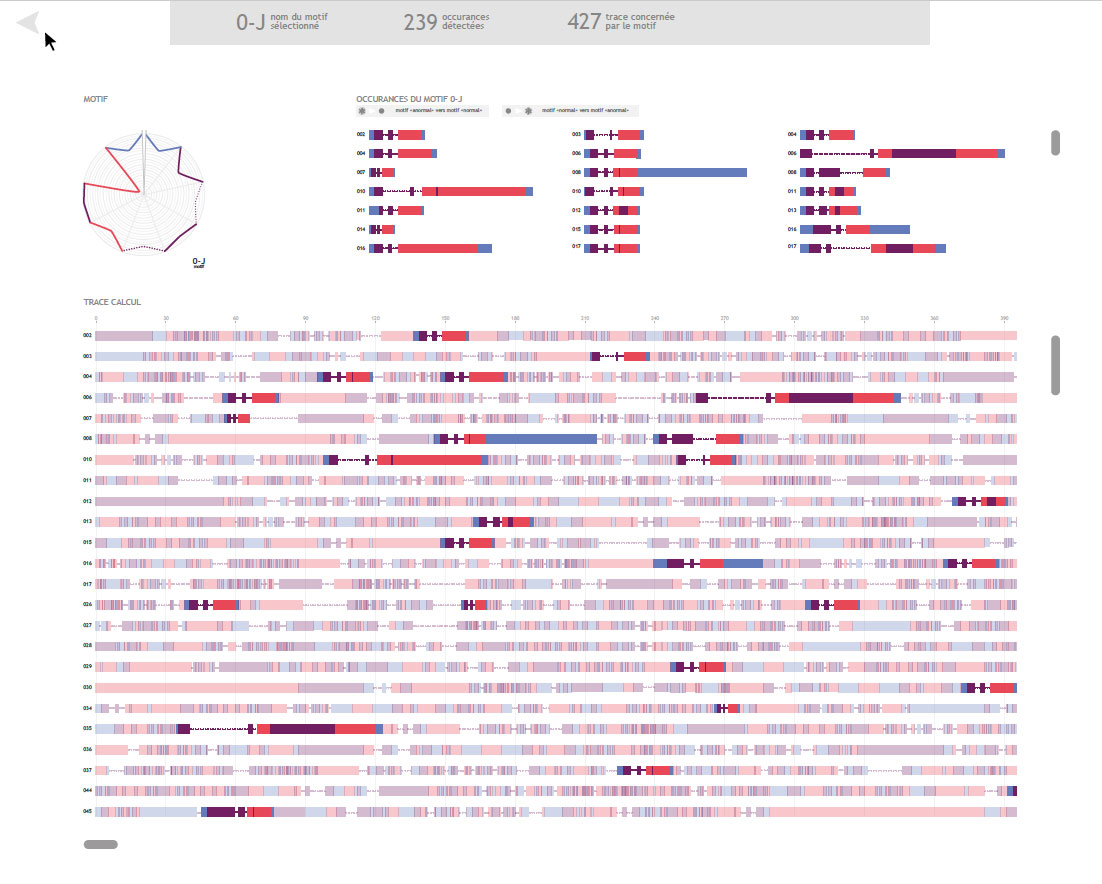
graphic hypothesis by Céline Mast - pdf
graphic hypothesis by Mélanie Peretti - pdf
graphic hypothesis by Rémy Sénégas - pdf
Prototype
François Trahay chose Céline Mast’s proposal. A work of precision of the interface followed. The computer prototyping phase encountered unexpected technical complexities related to the identification of patterns in the trace and their post-processing. The developers’ attention was focused on these points and it was not possible to integrate the graphic specifications and finalize a complete prototype. The proposal therefore ends with static screens.
A project of the Datavisualisation programme
Esad de Reims
Télécom SudParis / IMT, IP Paris
Graphic Designers
Céline Mast
Laura Ollivier
Mélanie Peretti
Laurane Richard
Remy Sénégas
Engineers
Jérôme Berthelin
Emma Goldblum
Maxime Guillem
Victor Rouquette
Researcher
François Trahay, département d’informatique de Télécom SudParis
Organisation & supervision
Olaf Avenati - Esad de Reims
Michel Simatic - Télécom SudParis / IMT, IP Paris
