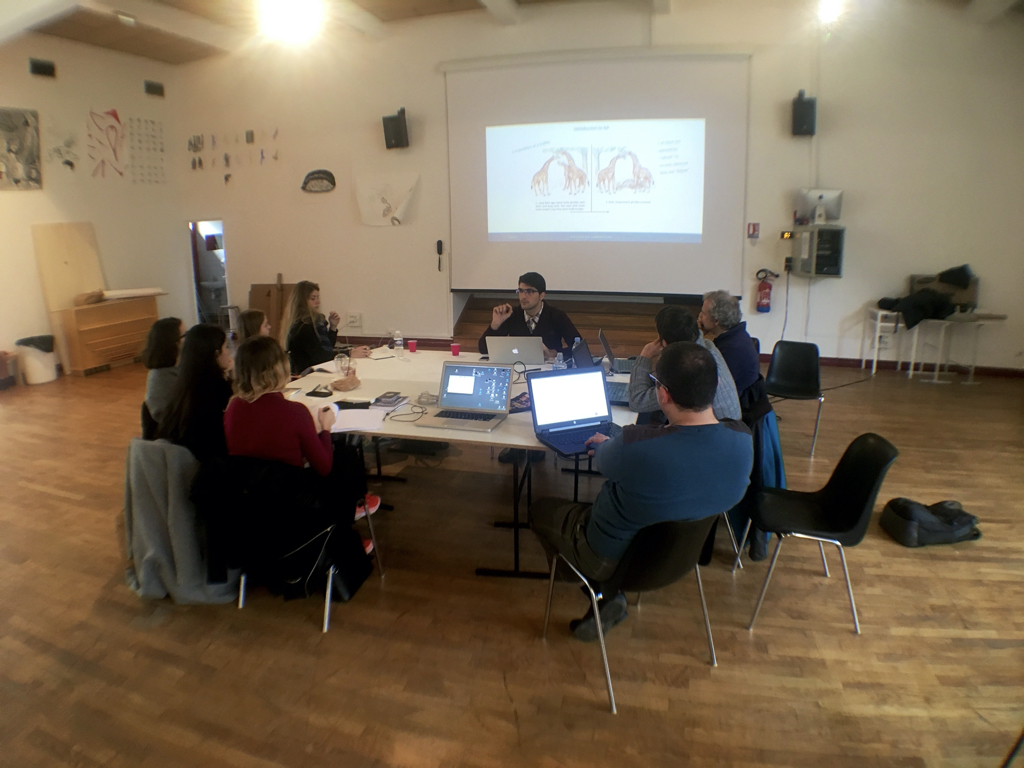
GA-viz - Genetic algorithm visualisation Datavisualisation Programme #3, 2017
The work consists of giving visual form to the massive computation method which uses the genetic algorithm. This method of calculation makes it possible to seek the best approximate solutions to a problem that is too complex to be solved with the resources at our disposal. The best approximation(s) is/are sought in relation to an expected result.
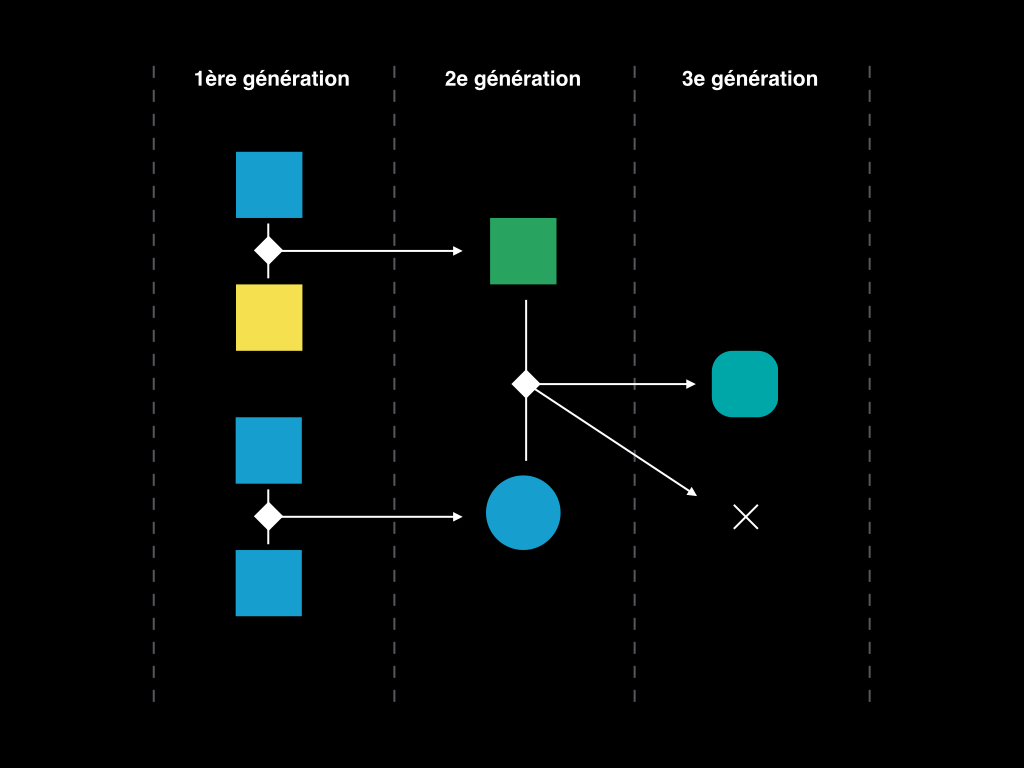
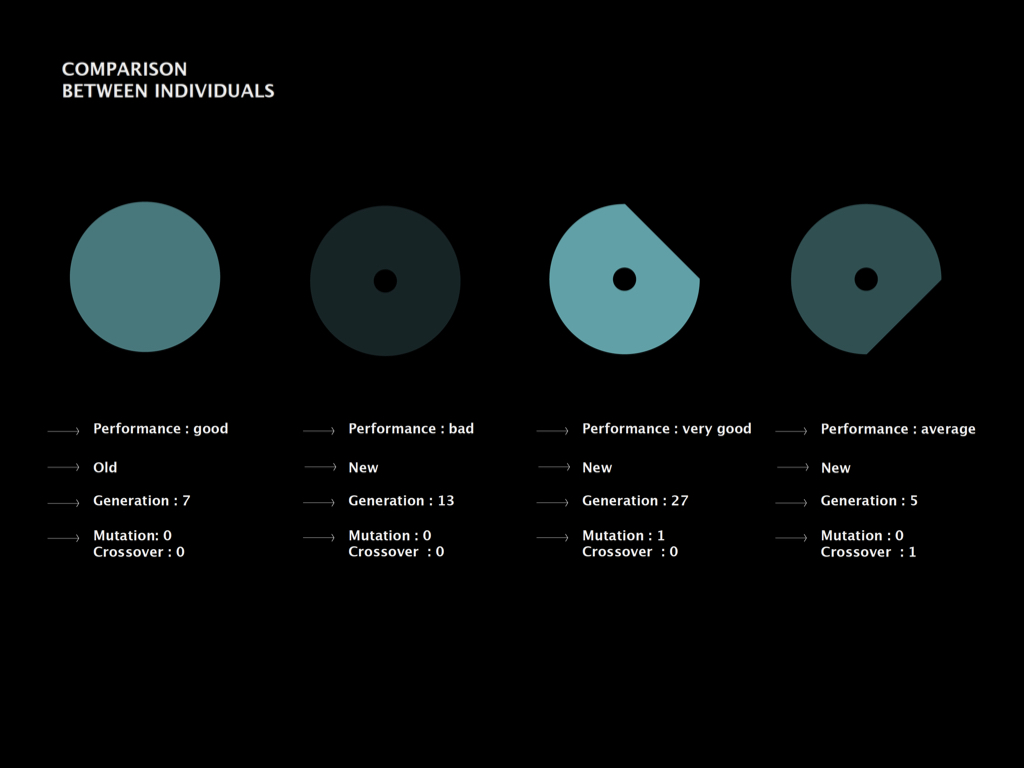
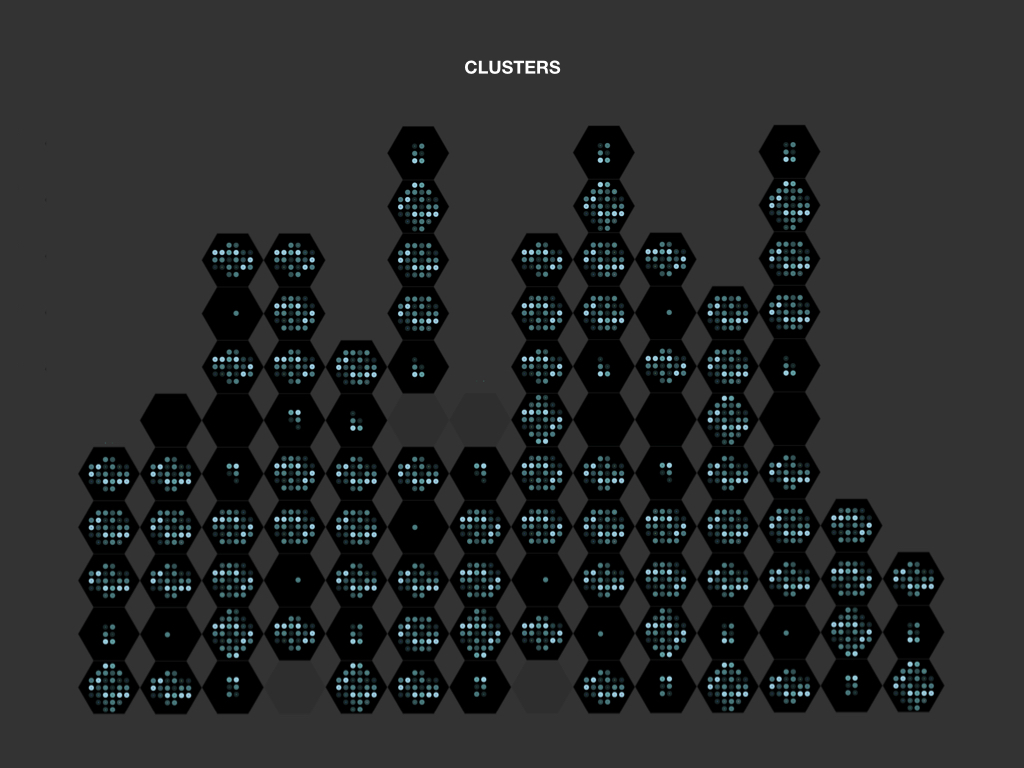
Inspired by the process of natural selection described by Charles Darwin, the algorithm randomly generates a first generation of potential solutions and performs a filtering to select the solutions closest to the objective (the fitness function). Then, the selected individuals will be crossed with each other to produce a new generation of solutions, in principle even more adapted to the objective. By repeating the operation N times, better approximations of the expected objective are gradually obtained. To avoid genetic dryness in the calculation, a portion of the individuals in each generation is endowed with mutant genetic traits.
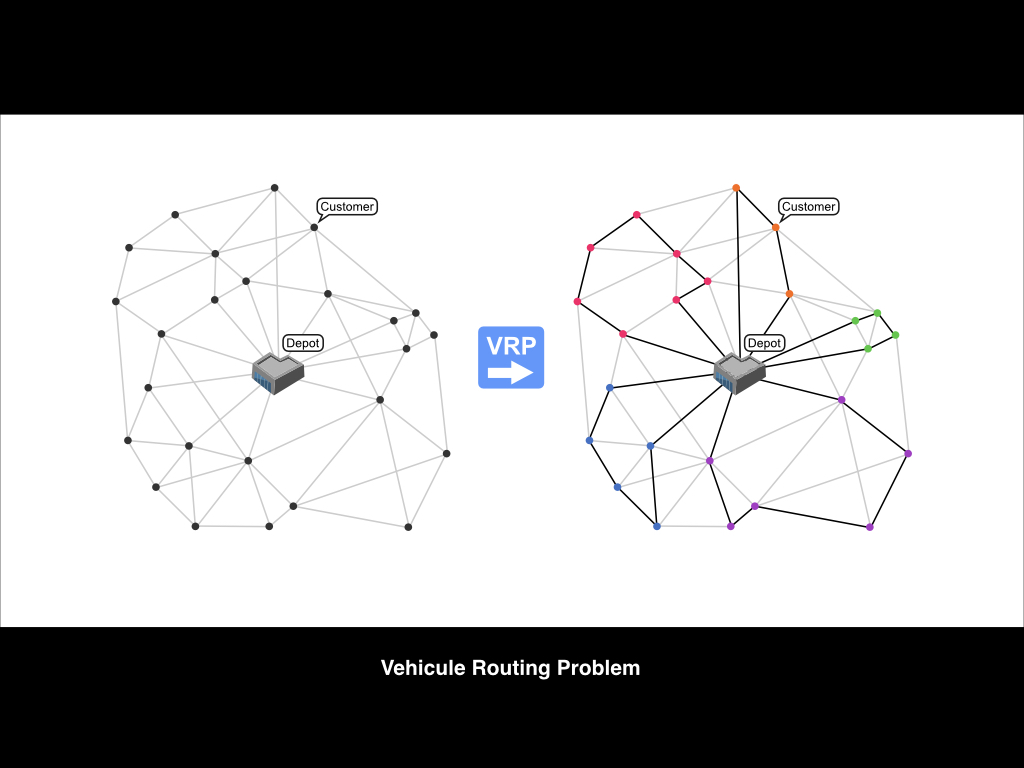
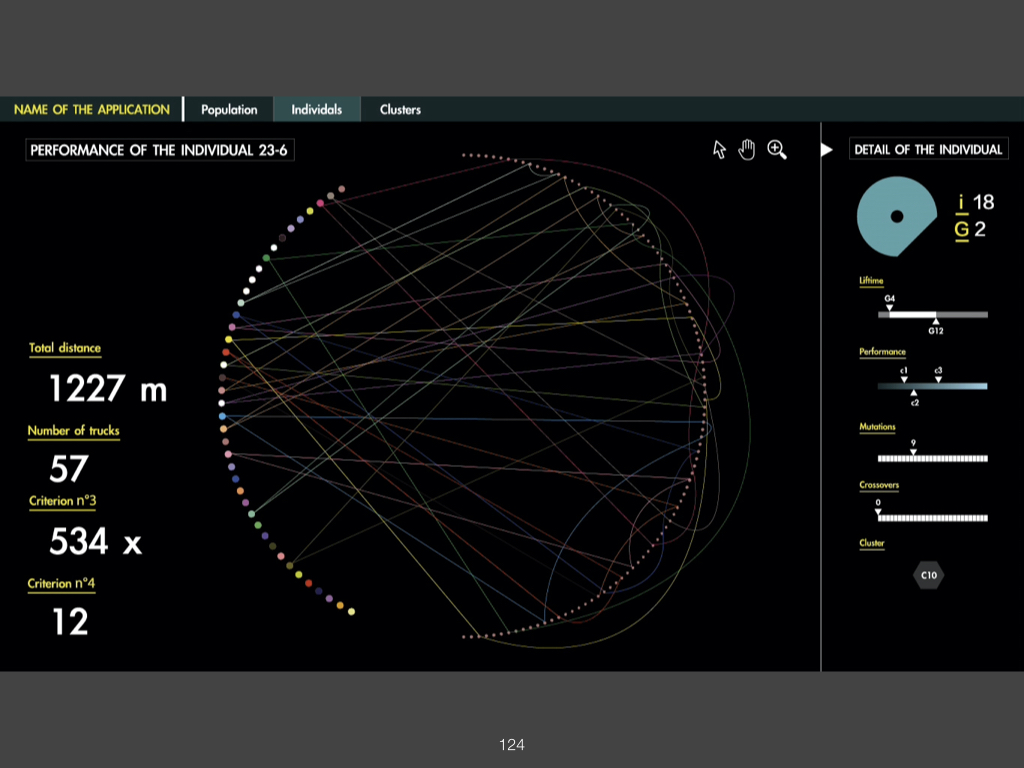
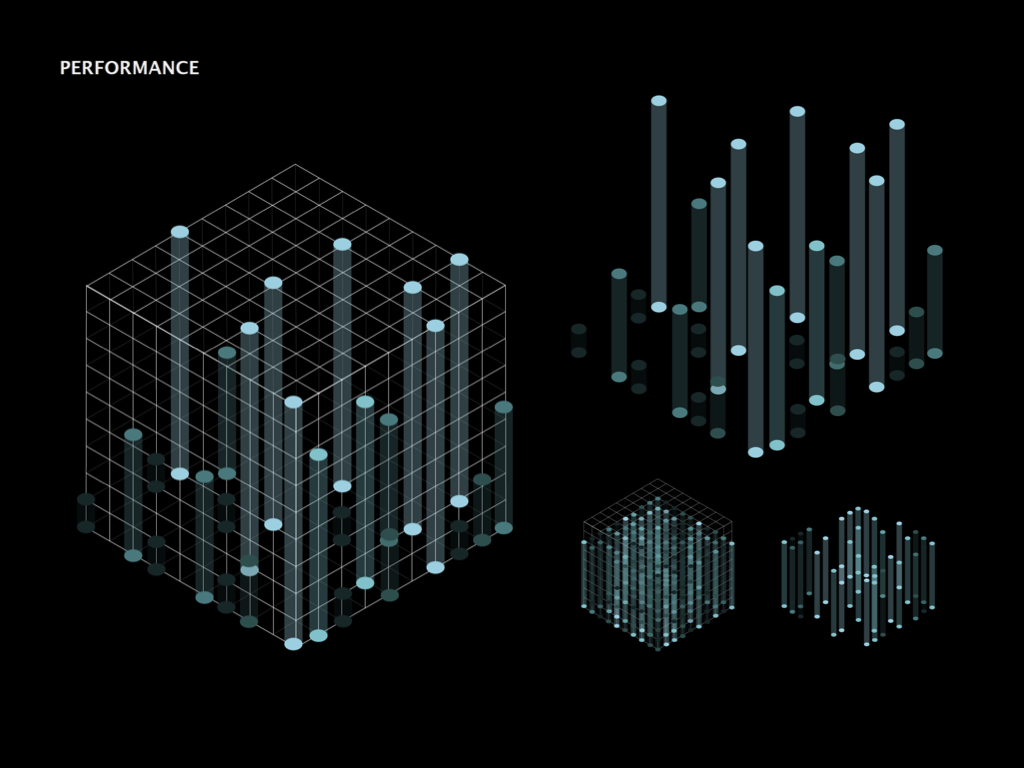
In collaboration with the Iranian researcher Habib Daneshpajouh, the group is trying several visual approaches to represent a typical case study of the genetic algorithm called Vehicule Routing Problem. A delivery round can be organised in multiple ways. Which one will be the most efficient with respect to a given criterion (total distance travelled, duration of the round, etc.)? The challenge of graphic design: to give shape to individuals, generations, hierarchies of selection. The digital design issue: developing an interface to navigate the calculation process.
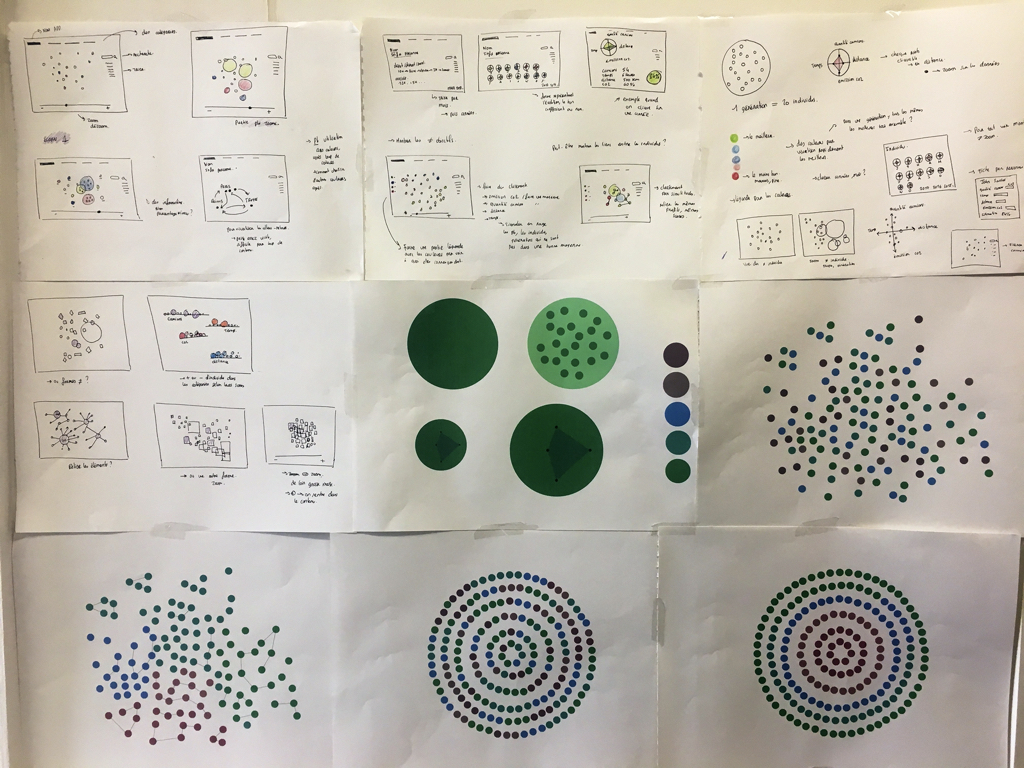
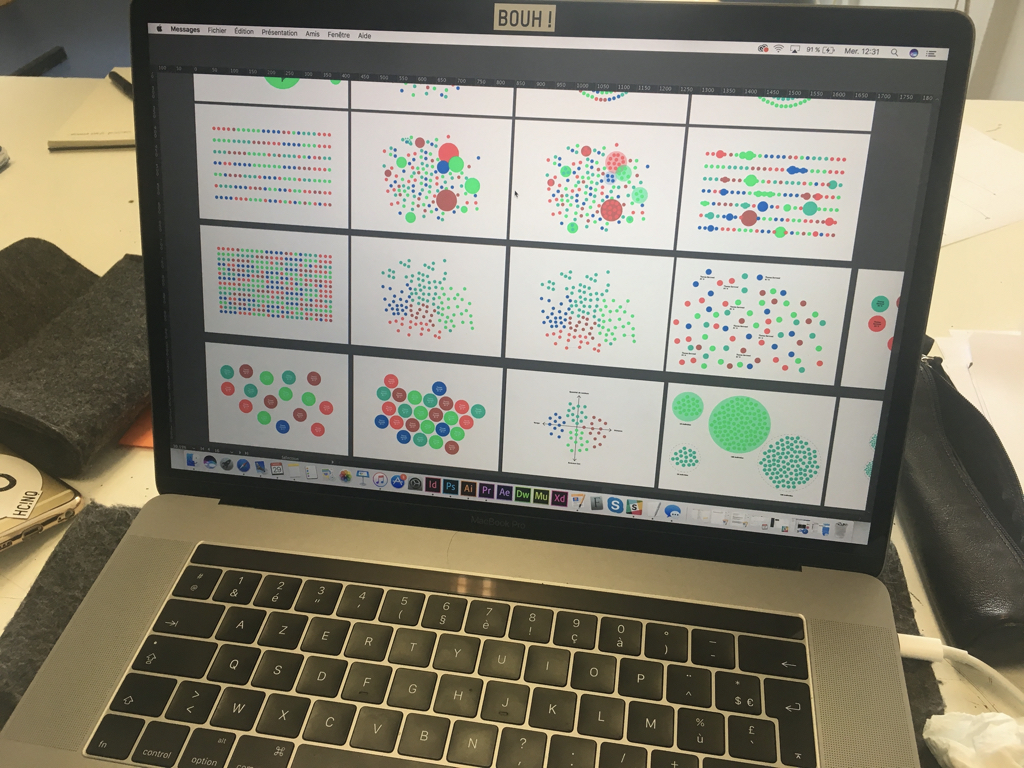
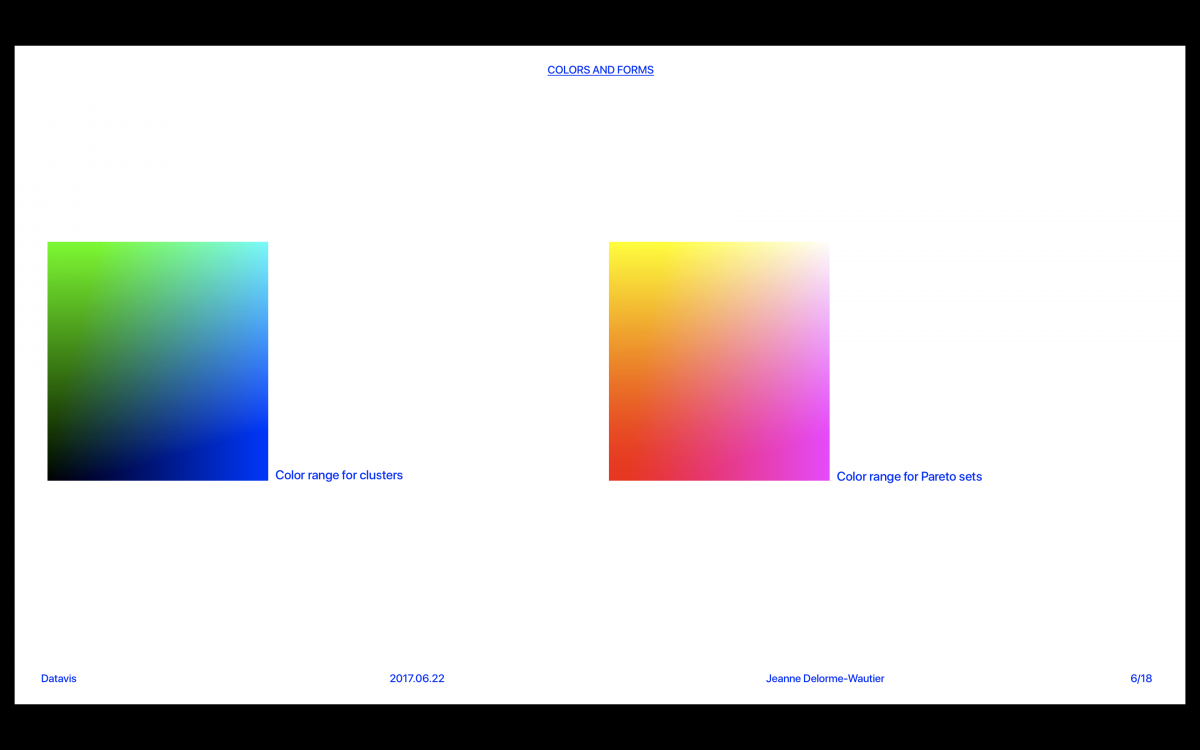
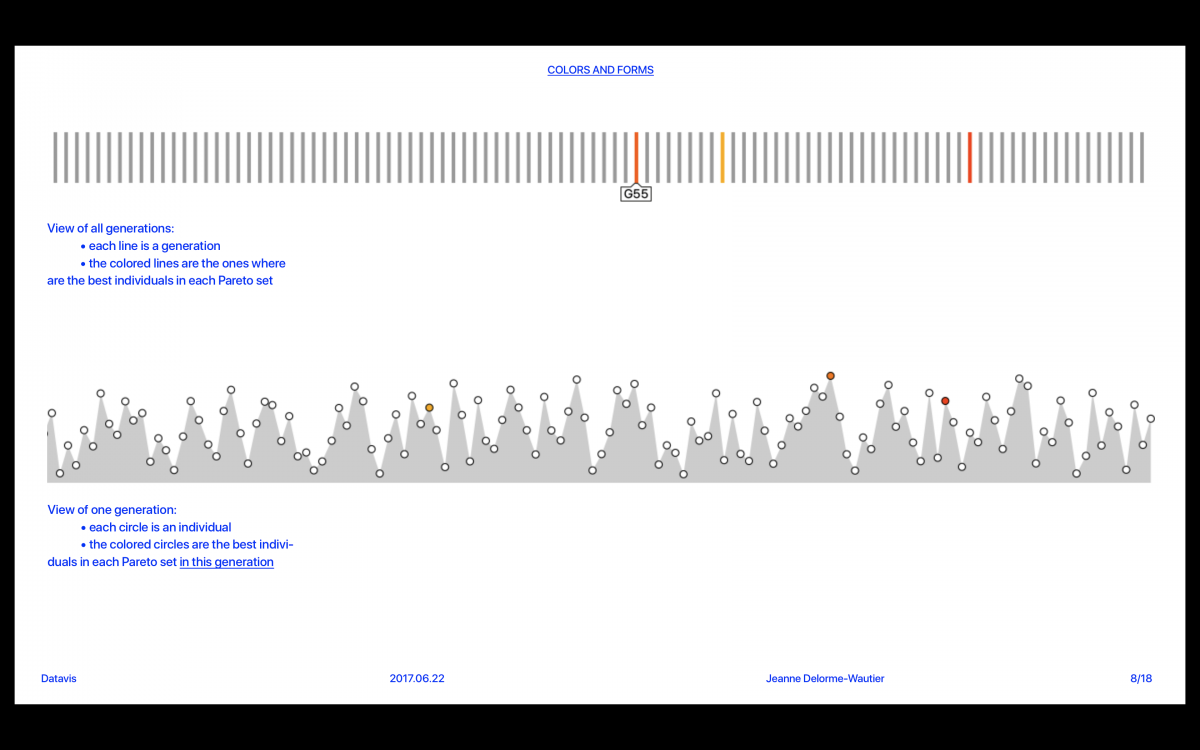
Visual research
Video presentation of the interface design
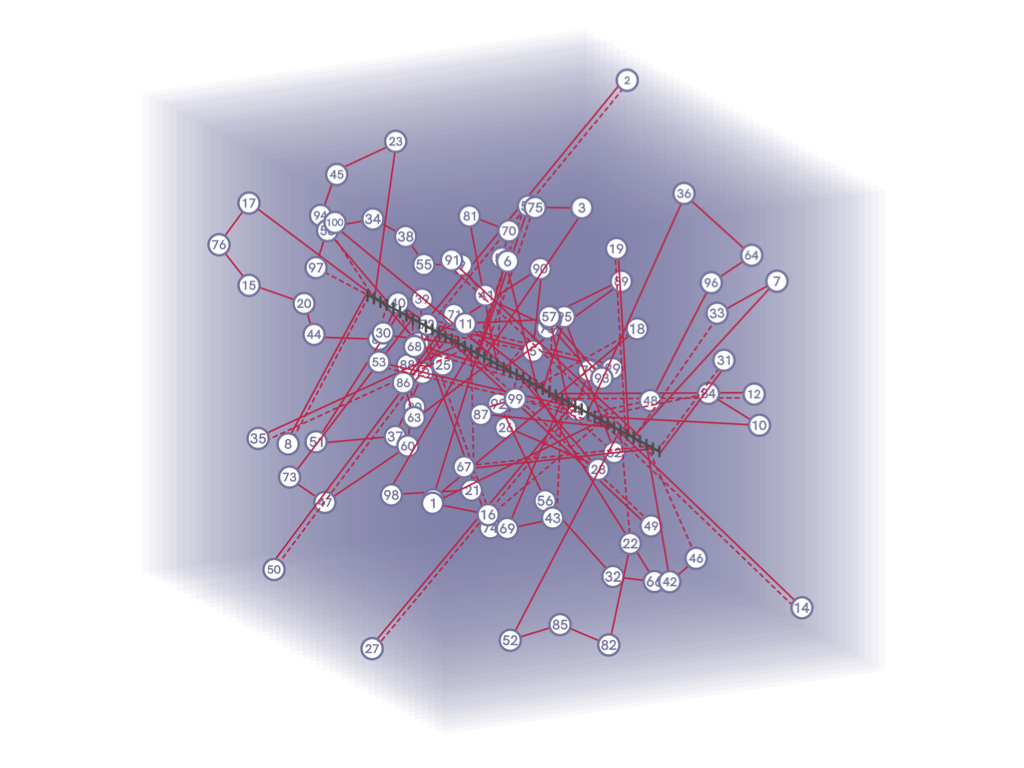
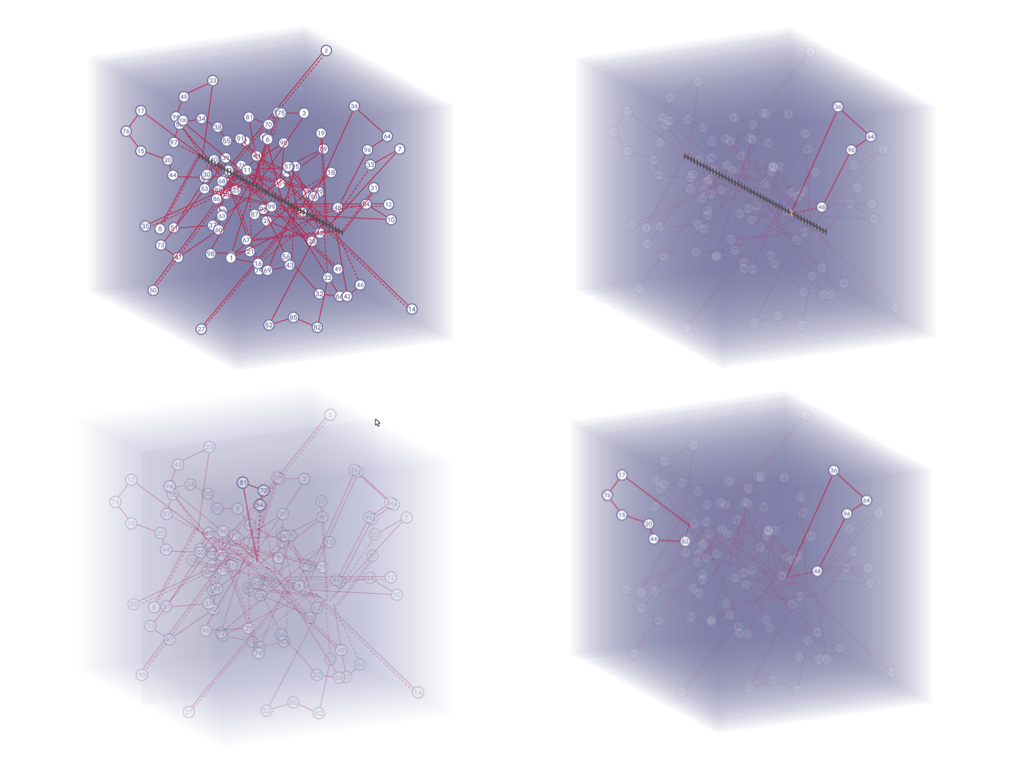
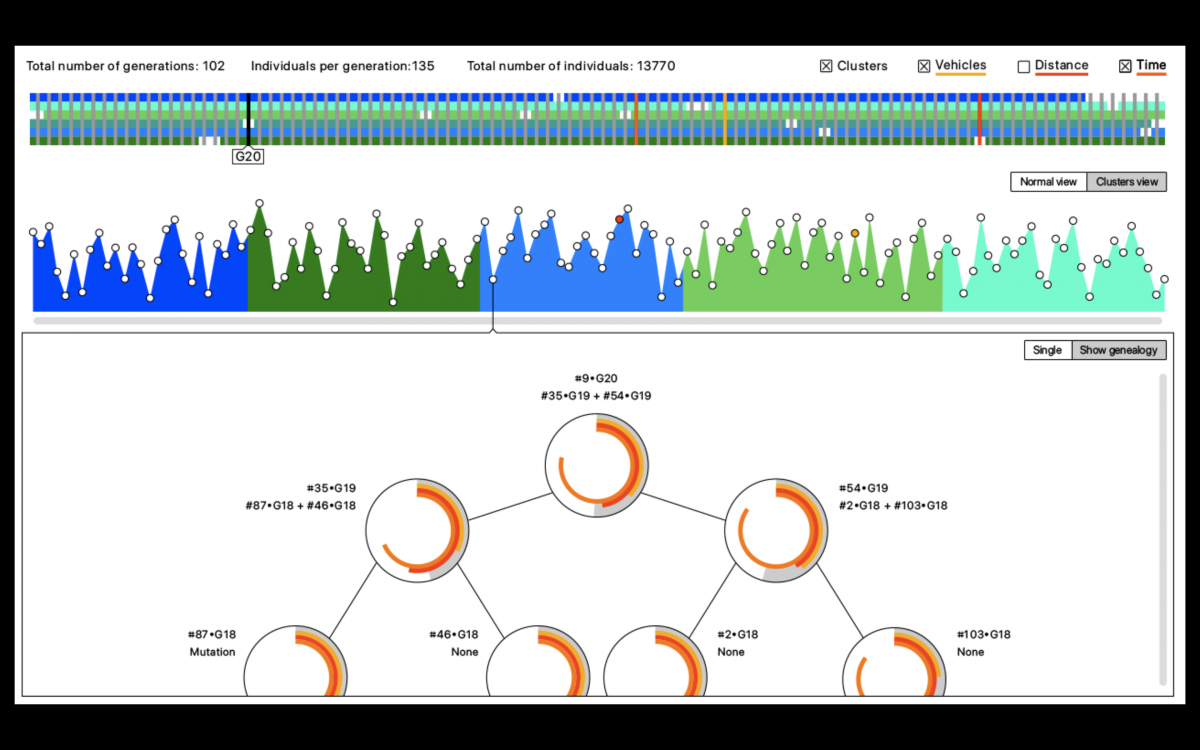
Principles of the final interface of the project, after evaluation of the different paths explored.
Modifier vos réglages de cookies
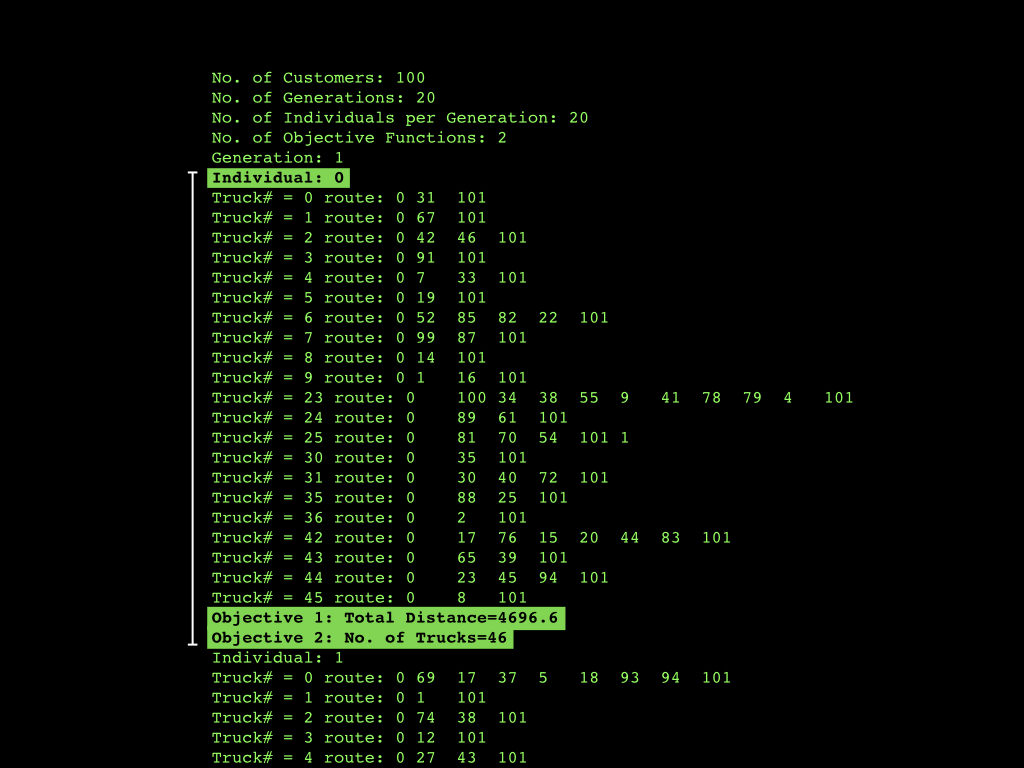
Video presentation of the functional prototype
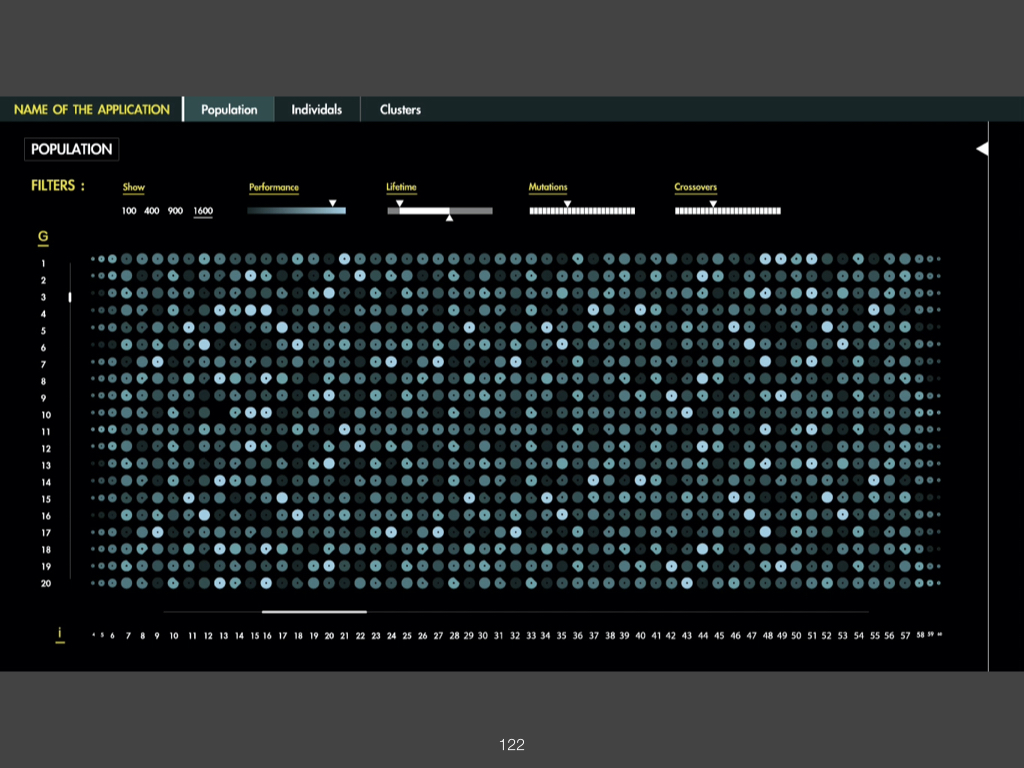
Produced by TSP engineering students, this prototype partially integrates the graphical interface and focuses on the technical chain in a real situation (loading of real calculations, scaling of quantities of individuals and generations, software structure, etc.).
Modifier vos réglages de cookies
A project of the Datavisualisation programme
Esad de Reims
Télécom SudParis / IMT
Graphic Designers
Alice Dubreuil
Jeanne Delorme
Pia Gaussot
Odyssée Khorsandian
Seul Kim
Sindy Serapicos
Engineers
Victor Person
Benjamin Cloquet
Thomas Jacquemin
Olivier Freyssinet
Pierre Touchard
Researcher
Habib Daneshpajouh, Department of Computer Science, Petronas University of Technology / Malaysia
ROMÉO Supercomputer
Jean-Mathieu Etancelin, Computer Science Department of the University of Reims Champagne-Ardenne
Organisation & supervision
Olaf Avenati - Esad de Reims
Michel Simatic - Télécom SudParis / IMT
